Raw .NET Data Access / ORM Fetch benchmarks of 16-dec-2015

It’s been a while and I said before I wouldn’t post anything again regarding data-access benchmarks, but people have convinced me to continue with this as it has value and ignore the haters. So! Here we are. I expect you to read / know the disclaimer and understand what this benchmark is solely about (and thus also what it’s not about) in the post above.

The RawDataAccessBencher code has been updated a couple of times since I posted the last time, and it’s more refined now, with better reporting, more ORMs and more features, like eager loading.

The latest results can be found here. A couple of things of note, in random order:

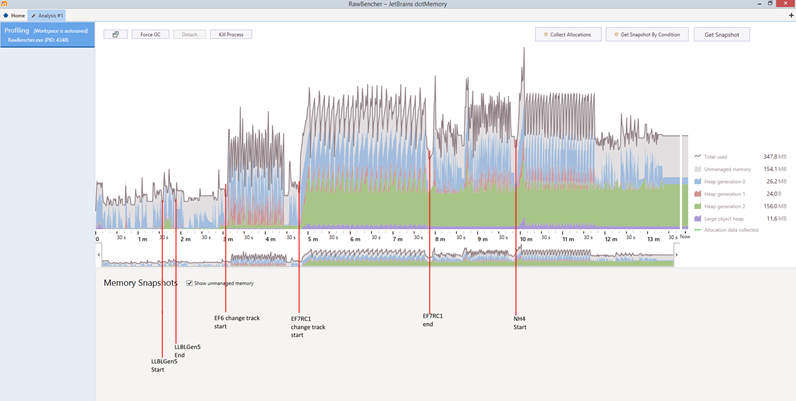
  • Entity Framework 7 RC1 (which we used here), is slow, but later builds are faster. It’s still not going to top any chart, but it’s currently faster than EF6, according to tests with a local build. We’ll update the benchmark with results from RC2 when it’s released.
  • LLBLGen Pro v5.0, which is close to beta, has made a step forward with respect to performance, compared to the current version, v4.2. I’ve optimized in particular the non-change tracking projections as there was some room for improvement without cutting corners with respect to features. The results shown are achieved without generating any IL manually. The performance is better than I’d ever hoped to achieve, so I’m very pleased with the result.
  • The NHibernate eager load results are likely sub-optimal, looking at the queries, however I couldn’t find a way to define a more optimal query in their (non-existing) docs. If someone has a way to create a more optimal query, please post a PR on GitHub
  • The DNX build of the benchmark currently doesn’t seem to work, at least I can’t get it to start. This is likely due to the fact it was written for Beta8 and current bits are on RC1 and tooling changed a lot. As their tooling will change again before RTM, I’ll leave it at this for now and will look at it when DNX RTMs.
  • The eager loading uses a 3-node graph: SalesOrderHeader (parent) and two related elements: Customer (m:1, so each SalesOrderHeader has one related Customer) and SalesOrderDetail (1:n). The graph is a graph with 2 edges which means frameworks using joins will run in a bit of a disadvantage, as the shortcoming of that approach is brought to light. The eager load benchmark fetches 1000 parents. 
  • The eager loading only benches change tracking fetches and only on full ORMs. I am aware that e.g. Dapper has a feature to materialize related elements using a joined set, however it would require pre-defining the query on the related elements, which is actually a job the ORM should do, hence I decided not to do this for now. Perhaps in the future. 
  • The new speed king seems to be Linq to DB, it’s very close to the hand-written materializer, which is a big achievement. I have no idea how it stacks up against the other micros in terms of features however.

(Update)

I almost forgot to show an interesting graph, which is taken with dotMemory profiler from Jetbrains during a separate run of the benchmarks (so not the one taking the results as profiling slows things down). It clearly shows Entity Framework 7 RC1 has a serious memory leak:

memtraceBencher

(update)

As some people can’t view pastebin links, I’ve included all results (also from the past) as local files to the github repository.
16 Comments

  • I really appreciate the raw results, but a graph or chart would certainly help those of us who are visually inclined.

  • @Joshua: at the top of the raw results is a list of the final results with mean and standarddeviation, sorted by time taken and grouped by category. Did you overlook that one?

  • Unfortunately our organisation blocks PasteBin as 'personal storage' so I can't see the results here :(

  • @pete: I've added them as files to the repository now: https://github.com/FransBouma/RawDataAccessBencher/tree/master/Results

  • Great comparison, thanks a lot!

  • Interestering results.

    I do feel there are a few (minor) design flaws in the benchmarker that reduce confidence in the results slightly.

    - You GC between *every* loop iteration. That's excessive. Part of writing high performance code in .NET is avoiding creating garbage in the first place, and if you need to create garbage, to do so cheaply (e.g. keep it in gen0). By GC'ing all the time, you're making profligate allocators appear faster that they really are, and may even make frameworks that reuse objects appear slower.

    - Your benchmark should really execute queries in parallel, or generate fixed CPU load to consume other cores, or use processor affinity to ensure that low load does not mean that the GC can execute "for free" on another core. That's just not a realistic workload - if you care about the performance of your ORM enough for this kind of benchmark, I'm assuming your real-world workload is likely multithreaded (e.g. a webserver), and it won't have the luxury of a free core to dedicate to GC (and even a concurrent GC isn't entirely concurrent). Also, caching is trickier in a multithreaded workload, so adding threading makes those kind of tricks a little more "honest". In my experience you'll like see a higher standard deviation, but also greater separation between frameworks if you do this.

    - 25 loop iterations of 100 queries seems to be a rather low number.

    - Creating fresh (albeit pooled) connections all the time is not free, and imposes unnecessary overhead over the results which makes the differences between frameworks appear smaller than they really are.

    - The choice to map a query exactly onto a predefined and compile-time known table means that it's quite likely that tools such as EF have an unusually easy time.

    - The performance numbers in the results seem low, but that may be hardware, not just aforementioned software issues. On a local DB, a quick test shows I get on the order of 10000 queries per second, each of which return (on average) 200 rows with 6 columns. Without parallelism, that number drops to around 2000, and with single-row result the numbers are around 10 times higher. That's *around* 10 times faster that what your benchmark is reporting. Since it looks like you're benchmarking on a remote db, that may mean you're primarily benchmarking network latency - you really need parallelism to provide enough load to actually test the frameworks.

  • @Eamon. First please read https://weblogs.asp.net/fbouma/re-create-benchmarks-and-results-that-have-value so I don't have to repeat myself here. Most of the answers to your remarks are answered there.

    The benchmark isn't trying to reflect a realistic scenario as that's impossible: what's realistic for A is unrealistic for B. The benchmark is testing how fast materialization is of a resultset in clean-room circumstances. The clear motivation is that in 'real life' it will always be worse than that.

    ad: low number of iterations: that's why there's a stddev and a mean. I can run them a 1000 times but it will take ages. I ran them a whole night with 500 runs and it wasn't done after several hours due to the slow EF6, 7 and NH queries. The results were also not different than when 25 runs are run, and as I explained in the article linked above, there's a reason for that: it's not expected to change over time.

    ad: fresh, pool connections: no, you're mistaken. Getting a connection from the pool is very quick (<1ms) and all frameworks have the same disadvantage. This is done deliberately so cheats are not possible in this context

    ad: choice of mapping: I don't see your point, to be honest: ORMs with mappings know types up front, that's why they have mappings. Dynamic using micro ORMs are having a disadvantage, but that's the consequence of their design.

    ad: perf numbers seem low. This is due to the fact the set is fetched over the network. This isn't testing network latency, it simply assures a local DB doesn't starve the framework's CPU resources during querying. If network latency was the main bottleneck, all results would be close together, which isn't the case. Also, if you look into it and profile the actual code you'll see it's not about network latency at all.

    It's great you get 10K queries/sec with 200 rows and 6 columns. The benchmark uses a wide table with a lot of different types and 31K rows. This is done for a reason.

    Please do realize I write ORMs for a living for a very long time now, performance of ORMs isn't something I happen to ran into, it's a part of my job. The benchmark was designed for *one* aspect of ORMs only, and *not* a way to represent real-life, as again, that's useless. It's solely meant to show that framework X is much faster than framework Y when it comes to materializing sets from resultsets. If in real-life the ORM is dealing with less ideal circumstances (read: that's always the case) things will be *worse*, they'll *never* get better.

    Yes, I'd have liked to have memory footprint numbers along the benchmark numbers, but .NET doesn't allow you to pull these numbers reliably without perf loss of the actual application (so that would influence what we're measuring!). C'est la vie.

  • Like I said, I think the results are interesting and points of (hopefully constructive) criticism were relatively minor. I don't expect the results would be dramatically different if you changed the benchmark based on this criticism. I'm really happy somebody (you!) took the time to write a careful benchmark with meaningful results. Based on the github project this project has been around along time, so I'm sure it comes across as a little out-of-blue to come complaining (but really: they're MINOR points!) about things that don't seem to matter from your perspective. However, from my experience, microbenchmarks are tricky to interpret; and I just came across this project now, so in an effort to understand the results I looked into the code.

    I just ran a minimal example of 100000 iterations of single-row result sets unpacked with handrolled consumer (after a 2 execution warmup) locally, and the difference between connection reuse and recreation is 43.52µs ~ 9.01µs vs. 59.13µs ~ 10.35µs. The overhead is likely comparable between frameworks so it's "fair" but since there is measurable overhead including connection recreation isn't a lower-bound on runtime (which you're aiming for). Clearly this isn't going to matter for full-set benchmarks.

    Incidentally, using 2500 iterations (instead of 100000) resulted in 45.32µs ~ 10.99µs vs. 61.24µs ~ 11.22µs, (after a 2 execution warmup). The small qualtiative difference is reproducible after multiple attempts. It's tiny - agreed. (CPU clockrate was fixed and speedstep off to ensure slow clockspeed rampup for the short run was not an issue).

    I agree the choice of EF mapping is fine. I mentioned it only because EF uses a fairly expensive query builder (to compile the expression tree to sql) that is mostly sidestepped in a case like this. EF tends not to do as well in benchmarks elsewhere, which may be due to that. I don't think it's a major issue, and of course I may be mistaken.

    Use of the network: the cpu cost of running a local sql server adds less noise to the results than the network does. That's easy enough to test. Also, for "trivial" queries such as these, the CPU cost in sql server is essentially always lower than the serialization costs in .net, even for handrolled datareader-consumers, so if you're running on at least a dual-core machine there's not likely to be much impact on the client process.

    You state that "If network latency was the main bottleneck, all results would be close together, which isn't the case." - well, for the single-row result set most results *are* very close together, and many times slower than what I'm measuring locally, which supports the notion that those results *are* primarily measuring various non-framework overheads.

    BTW, your standard deviatiations there aren't quite what you'd expect - you're reporting the standard deviation the (effectively) the mean of 100 individual fetches, as opposed to the standard deviation of the time an individual fetch takes (which you'd expect to be sqrt(100) times higher).

    As to representative workloads - I don't agree that they're useless (any more than any benchmark is useless), but I also respect that a microbenchmark can be elucidating precisely due to its simplicity. I understand that GCs make the results somewhat noisier, but discounting them introduces bias in the measurements (allocation rate may differ considerably between frameworks), which is also far from ideal. It's not a question of the impossibility of picking one workload over another; all real-world workloads will include GC.

    As proxy for allocation rate, you might look at GC.CollectionCount(0). It's not ideal, but it's not completely hopeless either. You may need to do more iterations to get a number high enough for any precision.

    I don't mean to be overly critical - none of the points are particularly impactful, but I do believe that you can tweak the benchmark to remove overhead (not so much for the full-set benchmark, but certainly for the individual fetch benchmark) such that the differences between the frameworks become more apparent. The point of a microbenchmark is to learn something that lets you predict at least one part of real world performance. Including things like network latency makes that a little harder because the simplistic math of "this framework is twice as fast so can deal with twice as many requests/sec" no longer applies in the real work - the differnce may be considerably *larger* since in the real world latency-hiding concurrency is always in the mix.

  • @Eamon: Thanks for your thoughts on this. However I have the feeling you didn't read the article I pointed at, as your reply clearly shows you think the benchmark does things it isn't designed for. I'll recap some of it below:

    ORMs have a couple of areas where most of the time using an ORM will be spent:

    a) fetching data and materializing objects from that data
    b) converting query in language L to SQL
    c) graph traversal and determining which operations to perform to persist the changes found in said graph. (in short: Unit of Work management)

    and a couple more.

    The benchmark is clearly designed to test a) and only a) and therefore not b) nor c) nor anything else. This particular area was chosen as a) is the area where a lot of users will see an ORM affect their application's performance the most, as most applications read more data than write it.

    I didn't just pick a table at random, I deliberately picked this one for this purpose, as it has a lot of rows, nulls, a lot of columns and above all, a lot of different types, some of them strings. It also has a lot of related types, so if the ORM is affected by that, it will show. Remember, I know what ORMs do internally, what it takes to make a) happen at all.

    It also isn't designed to give you absolute numbers how fast things are, i.e.: that fetching 31K rows will thus take 2+ seconds on EF6. It took 2+ seconds in my setup. It might take 5 in yours or 1.5. What's important is how fast it is _compared to the others_. The baseline is the handwritten materializer using DbDataReader: in theory there's little chance anything gets faster than that: perhaps IL generated at runtime which is slightly more clever than the IL generated by the C# compiler might outperform it, but I doubt it. Mind you, we're testing performance of a) and only a). So the performance of an ORM in this benchmark compares to the handwritten materializer. If the handwritten materializer takes 120ms and ORM X takes 1.5 second, and ORM Y takes 500ms, then X clearly takes a tremendous detour compared to Y and the handwritten materializer, as it spends 1380ms somewhere else than materializing objects, while it should be doing only that.

    That's the takeaway of the benchmark as that's what's tested. Not absolute numbers, not whether an ORM is 'fast' or 'slow', not whether this scenario is close to 'real life usage' or not (nothing is), but how fast are they compared to each other in a specific task and only in that specific task.

    The benchmark was born from the need to test the performance of my own ORM (LLBLGen Pro) for a) against other ORMs. I did this for a long time in a simple console application but it was a bit of a mess, and it wasn't properly designed (it merely tested whether I was faster / slower than DataTable as for a long time that was the performance king, believe it or not). So I designed a benchmark system from scratch to test just a). Over time it received improvements and polish, but it never moved away from what it was designed to do: benchmarks are often used to fabricate lies and to give the suggestion that a conclusion can be drawn from its results while it's actually impossible, simply because the benchmark e.g. tests X and therefore a conclusion it is good at Y is premature and unfounded. I also designed it to show how the ORMs stack against each other (and only that!) in this important task of materializing objects, as there's still a lot of myth and nonsense spreading around like X is much faster at this particular important task than Y while the opposite is true (let's not name X and Y ;))

    So to accomplish a test for a) and a) alone, it has to avoid a couple of things:

    * no complex queries as that would mean it also tests b)
    * no local DB as a hit on the DB will automatically starve the app in theory: I want to avoid all self-inflicted limiting so all fetches are on a remote DB: the resultset is big, it will not affect a local app being benchmarked
    * no utilization of hidden features, it's just raw (hence 'Raw' in the name) fetch/materialization testing.

    As the network is to be used by all systems, it's a constant in the results and therefore not a factor.

    Could the test include a large complex query so linq based ORMs will have a serious disadvantage? Sure. But the purpose of this test wasn't to see how fast ORMs are in the context of b) nor c), it was a).

    I'd like to quote a line from your reply, even if I run the risk of quoting it out of context:
    > "the point of a microbenchmark is to learn something that lets you predict at least one part of real world performance. Including things like network latency makes that a little harder because the simplistic math of "this framework is twice as fast so can deal with twice as many requests/sec" no longer applies in the real work"

    This precisely shows you didn't understand what the benchmark was all about: you can't project the results to 'real world' req/sec scenarios. You can only learn one thing from the benchmark: framework X is faster than framework Y for the task tested and perhaps by how much (percent wise). The tests clearly show EF and NH are slow in materializing resultsets. Micros have a field day here (although some large ORMs also are fast nowadays ;)).

    However it's just part of the picture: to be able to perform a task very quickly it's crucial that the amount of overhead is very low. The farther away from the baseline result of the handwritten materializer a result is, the more it shows the ORM has a lot of overhead. This overhead can be justified, it can also be because its internal design is simply not done well enough, or slower performance is a tradeoff. E.g. my framework can't really be faster unless I cut corners, which I won't do. EF6 is terribly slow because they do a tremendous amount of complex tasks that are really unnecessary (profile it and you'll see). NH is slow because its design is deeply fragmented, so they can't really optimize it as the task at hand is performed by a lot of different methods all over the place. (profile it and you'll see).

    So using the results to calculate how many req/sec you can do is silly, for one as the numbers are not representative for any other situation but the one in the benchmark, and they test a single task only. It might very well be 80% of the time it takes to formulate a request to the DB in your app is spend in business logic and 20% in the ORM+DB. Just to give you an idea of how things relate to each other. This thus also means that if you move from e.g. Linq to Sql to Linq to DB your application won't get 100% faster, it will be somewhat faster, but not 100%, as your application won't spend 100% of its time in the ORM (I hope ;)), likely not even 30-40%.

    TL;DR: the benchmark is to test one thing only, and it goes out of its way to test just that, meaning it avoids to test anything else but that single task. You can't draw absolute conclusions from the results, other than how X compares to Y at the task at hand. It's not how ORMs will behave at runtime in a real world application. It only shows X has more overhead than Y for this task, materializing objects from resultsets, and if your app does that a lot (and a lot of apps do) your app will be slower if you use X than if you use Y due to the overhead X has compared to Y, but *how much* is not determinable from this test at all. It *will be slower* but that's it. How much slower is what you have to find out for yourself. It still might be very wise to pick a slower framework over a faster one because the slower one offers way more features and the overhead is therefore justified.

    It's a complex problem and people should understand the complexity of it before drawing conclusions. I know a lot of people don't, and for that I'm sorry, but I personally hate the amount of disclaimers I have to stick onto this kind of thing as people tend to form an opinion while at the same time avoid reading essential info. That's life, I guess.

  • You say "If the handwritten materializer takes 120ms and ORM X takes 1.5 second, and ORM Y takes 500ms, then X clearly takes a tremendous detour compared to Y and the handwritten materializer, as it spends 1380ms somewhere else than materializing objects, while it should be doing only that." and "You can only learn one thing from the benchmark: framework X is faster than framework Y for the task tested and perhaps by how much (percent wise)."

    That means you are aiming to to quantitative comparisons between the timings you're reporting. Including costs such as connection reconstruction and network latency is in direct opposition to that claim, for two reasons. Firstly, you no longer can hope to estimate by how much (percentage wise) - your estimates of percentage differences will be too low because you include a fixed cost in both. Secondly, these fixed costs are not complete constant - there is variance in network latency and connection construction. That means that even qualitatively you risk that the ranking between frameworks is noisier than necessary - and many frameworks are quite close in you measurements (for single row fetches). Compounded by the fact that the standard deviation is misreported, it's quite tricky to interpret those results.

    Finally, if indeed you want to know which framework is faster (even qualitatively), then it is incorrect to avoid counting the GC. In your results, it is conceivable for a framework to appear faster when in fact due to its high allocation rate it would in all cases make it slower (the GC costs cannot be avoided). A hypothetical alternative framework that uses a little more CPU while executing but avoids many allocations would appear slower, when in fact it might be faster.

    However, those issues are particularly relevant for the single-row fetches, and I notice that at least in this exchange you focus on the set-result fetches. If indeed you don't care about the accuracy of the single-row fetch benchmark, why not get rid of it?

  • > Firstly, you no longer can hope to estimate by how much (percentage wise) - your estimates of percentage differences will be too low because you include a fixed cost in both. Secondly, these fixed costs are not complete constant - there is variance in network latency and connection construction.

    The overhead of framework X is its time taken - the time taken by the handwritten materializer. I think that can perfectly be used to decide whether that framework has a lot of overhead or not.

    There's little variance in network latency and connection construction especially the latter, as I said earlier. All runs are effectively using pooled connections and as they're run after each other there are no pool underruns. The network variance is there, but not in the extreme, and it's a price to pay for the requirement not to benchmark on a local db.

    However if someone wants to run them on a local DB, by all means do so. The code is on github and everyone can run the tests locally.

    Single row fetches are close together as they're in general very fast, so differences are there, but they're not extremely big. The stddev is calculated over the 100 fetches and that indeed is wrong. I'll make a note of that (https://github.com/FransBouma/RawDataAccessBencher/issues/27)

    I have a bit of a hard time understanding what your point is though. I tried to explain (twice, in the original article I linked to and again above, which you in both occasions didn't read apparently) what the benchmark isn't, and you apparently want to make it just that. I don't see what is so hard to understand about the fact individual fetches of e.g. the handoptimized materializer take 0.54ms and petapoco takes 3.56ms and thus petapoco has way more overhead for an individual fetch (from start to finish) than the handoptimized materializer (which has no overhead). That's what I tried to explain several times and which you failed to grasp. It's not about whether it's 3.65ms or 2ms or 0.1ms, it's about whether it has more overhead or not. You can also see a Dynamic using ORM has a field day with the single element, as they have no setup of a type. For single fetches this overhead is a big part of the fetch, for dynamic using ORMs they don't have that so their overhead is very small. For large sets this is mitigated, as they then run into the problem that instantiating an Expando is more expensive than a type from a compiled lambda.

    This is shown in the results perfectly and exactly the point of the benchmark. You keep focusing on numbers, which are not what you should focus on in the absolute sense: the numbers paint a picture, but the absolute numbers are not usable, as I've explained a couple of times.

    > Finally, if indeed you want to know which framework is faster (even qualitatively), then it is incorrect to avoid counting the GC. In your results, it is conceivable for a framework to appear faster when in fact due to its high allocation rate it would in all cases make it slower (the GC costs cannot be avoided). A hypothetical alternative framework that uses a little more CPU while executing but avoids many allocations would appear slower, when in fact it might be faster.

    True, but there's no way to reliably include this: even if you issue a collect call, it might not take place right away, which makes it useless to include it, hence they're not included at all. If there was a way to include that reliably (but it's not possible to do so) I would.

    > However, those issues are particularly relevant for the single-row fetches, and I notice that at least in this exchange you focus on the set-result fetches. If indeed you don't care about the accuracy of the single-row fetch benchmark, why not get rid of it?

    I don't agree with your statement that they have a big impact on individual fetches. The initial goal was set fetches, but I included single result fetches because they paint a different picture in a lot of cases and the results show that. I wanted to illustrate the fact that an ORM uses different code paths for fetching a single element and fetching a set as you can optimize a great deal if you fetch a set. So they're part of the whole picture, the same goes for enumeration times: postponing work till things are enumerated are shown in these numbers (like with the Oak framework) and enumerating things is essential to use the data. They're shown in a separate set to distinct them from the fetch results.

    So they're part of the results to give meaning to the other results.

  • Additionally, and I think a big misunderstanding from your part comes from this (but it's a guess!), there's not much value in whether a framework becomes second of forth or whatever in the ranking, if the difference is minimal. I agree with you completely when you say that the network latency and other factors differ a bit per run and could tip one framework just below or above the other and therefore there's little to no value in that: it's within the margin of error.

    What's important is whether or not a framework has a huge overhead compared to the handoptimized materializer or not much. If it's not much, one can consider that framework to be nearly optimal and there's little else to wish for. If the overhead is huge, it's either used for features used during fetch which aren't shown in the end results (e.g. uniquing, proxy generation, type conversion setup etc. etc.) or the framework is not that efficient.

    I think that's the core take away of the benchmark and why I wrote it. Anything else that's been concluded from the results is not really useful.

  • (last posts were direct to Eamon, for the reader who gets confused whether I'm now correcting/disagreeing with myself or not haha ;))

  • My core issue is that you state that it makes little difference if you avoid the aforementioned overheads since all the frameworks are close anyhow, and that's just not true - I followed your suggestion and *did* run an almost identical benchmark locally without those overheads, and performance numbers are considerably higher, and in particular the differences between benchmarks are much more pronounced.

  • > I followed your suggestion and *did* run an almost identical benchmark locally without those overheads, and performance numbers are considerably higher, and in particular the differences between benchmarks are much more pronounced.

    What does 'almost identical benchmark' mean exactly? If it's not the exact same code it's apples vs. oranges. It still is with the same code too btw, comparing benchmark results obtained from different systems is useless.

    I don't deny local ran benchmarks likely will result in smaller numbers, but again that's not the point at all. There are other differences too: using a local DB will bypass networking libraries and therefore time spent on transporting the resultset and instead will use named pipes. It will also in theory cause the OS to spend time on the DB and not on the app benchmarked which could mean the DB system's work is directly influencing the performance of the benchmarked code (as the resources of the local system used for the DB are not available at that moment to the benchmarked app).

    I don't see how differences can be more pronounced if every framework has the same overhead as it's a constant (more or less) factor, not something that is a huge value in some framework and a small part in another. (with one exception: In the eager loading benchmark the resultset is much larger for some frameworks than for others, causing the network play a bigger part. This is intentional for obvious reasons (eager loading done with joins has side effects, which are clearly shown using this test))

  • @Eamon 'close together' compared to the set fetches, the differences between the frameworks is in most cases less than 1ms with single element fetches.

    Anyway, it's time to end this as it's run out of fun for me. You don't agree with how I do my benchmark, that's fine: fork the code and make your own. I do testing my way and if people think I'm insane because what I do is not useful, that's their choice and they can grab the code and do their own testing and draw whatever conclusion they want.

Comments have been disabled for this content.